
Business Context:
In today’s competitive landscape, data-driven marketing is essential for uncovering opportunities, optimising performance, and driving business growth. This project analysed multi-channel sales data to identify key trends, optimise channel strategies, and align product promotions with customer behaviours.
Key Insights Uncovered:
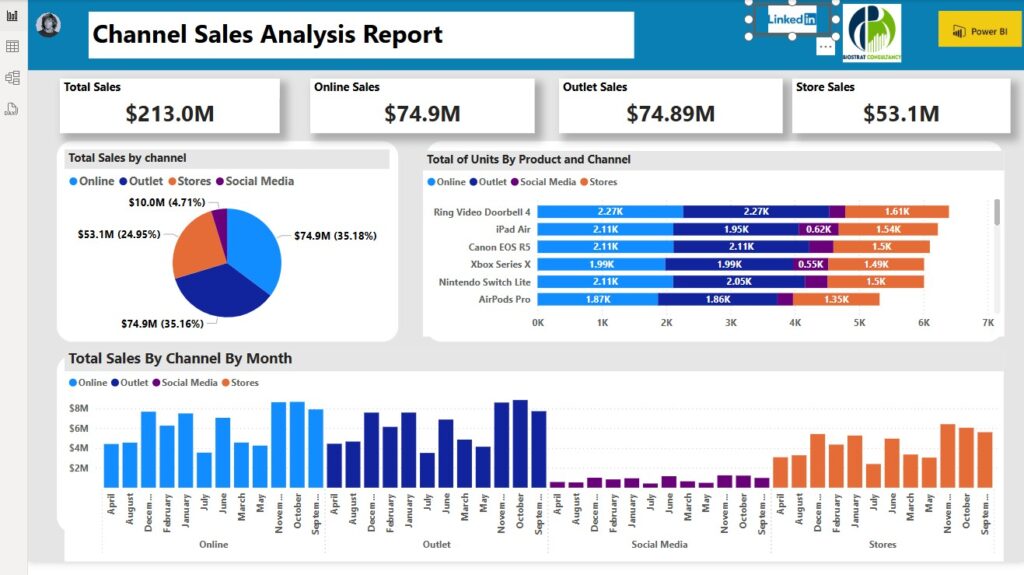
- Online and outlet sales dominate, each contributing ~35% of total sales, while social media, at $10M, shows strong growth potential.
- December is the most profitable month across all channels, highlighting the critical need for early holiday planning.
- Specific products, like the Ring Video Doorbell, excel in online and outlet channels, while the iPad Air performs best in stores.
Tools Used:
- Power BI: For visualisation and actionable insights.
- Excel: For initial data cleaning and organisation.
Process:
- Data Preparation:
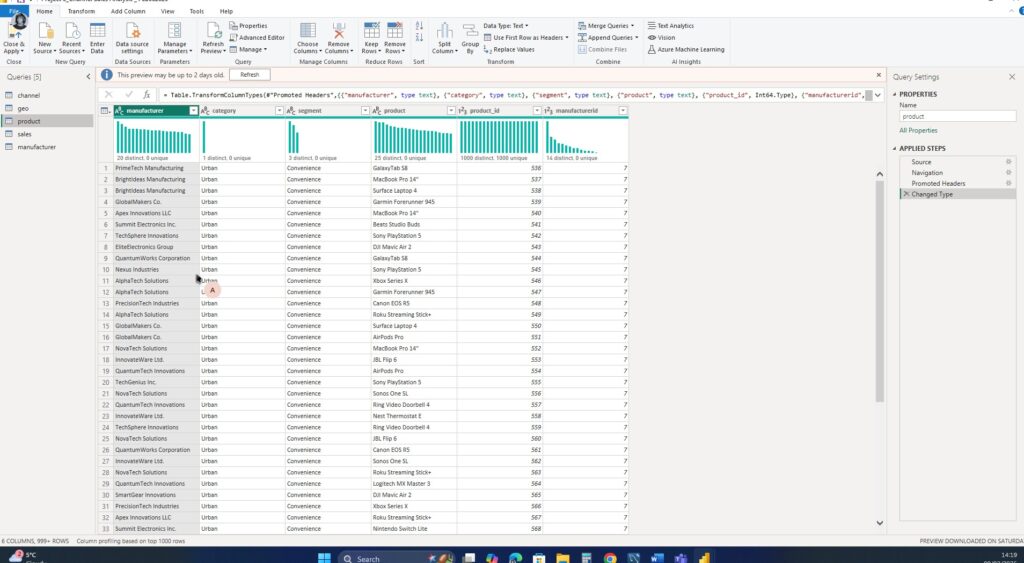
- Consolidated sales data from multiple channels using SQL.
- Addressed inconsistencies, handled missing values, and formatted the dataset for analysis.
- Dashboard Development:
- Designed a Power BI dashboard to visualize total sales, channel performance, seasonal trends, and product-level insights.
- Insights Generation:
- Applied advanced filters and measures in Power BI to transform raw data into actionable insights.
- Used visual storytelling techniques to highlight key business opportunities.
How To Establish a Relationship Between Tables

Key Takeaways for Business:
- Data as a Strategic Asset: Transforming raw data into insights enables smarter, data-backed marketing decisions.
- Channel Optimization: Invest in high-performing channels like online and outlet sales while nurturing emerging platforms like social media.
- Proactive Seasonal Planning: Use predictive planning to prepare for peak periods like December, maximising ROI during high-revenue months.
- Product-Channel Alignment: Tailor product promotions and distribution strategies to effectively match where customers shop.
Why This Matters:
This dashboard bridges the gap between data and action, providing marketers with the insights needed to optimise campaigns, refine strategies, and unlock new growth opportunities. Businesses can turn complexity into clarity by leveraging tools like Power BI and SQL and drive better marketing results.
Ready to Make Data Work for You?
Let’s connect to explore how a tailored dashboard can empower your marketing strategy and fuel business growth!
Call To Action

Check Out My Work | Follow Me On LinkedIn | Subscribe For More
